opencv入门9:直方图-histogram

什么是直方图呢?通过直方图你可以对整幅图像的灰度分布有一个整体的了解。直方图的x 轴是灰度值(0 到255),y 轴是图片中具有同一个灰度值的点的数目。

直方图其实就是对图像的另一种解释。一下图为例,通过直方图我们可以对图像的对比度,亮度,灰度分布等有一个直观的认识。几乎所有的图像处理软件都提供了直方图分析功能。下图来自Cambridge in Color website,强烈推荐你到这个网站了解更多知识。
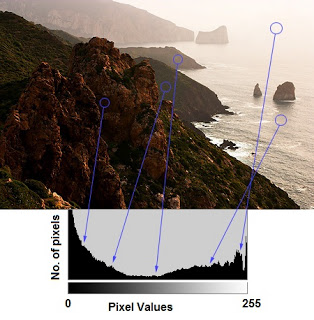
让我们来一起看看这幅图片和它的直方图吧。(要记住,直方图是根据灰度图像绘制的,而不是彩色图像)。直方图的左边区域像是了暗一点的像素数量,右侧显示了亮一点的像素的数量。从这幅图上你可以看到灰暗的区域比两的区域要大,而处于中间部分的像素点很少。

一、使用opencv计算直方图


方法:cv2.calcHist(images,channels,mask,histSize,ranges)
1. images: 原图像(图像格式为uint8 或float32)。当传入函数时应该
用中括号[] 括起来,例如:[img]。
2. channels: 同样需要用中括号括起来,它会告诉函数我们要统计那幅图
像的直方图。如果输入图像是灰度图,它的值就是[0];如果是彩色图像
的话,传入的参数可以是[0],[1],[2] 它们分别对应着通道B,G,R。
3. mask: 掩模图像。要统计整幅图像的直方图就把它设为None。但是如
果你想统计图像某一部分的直方图的话,你就需要制作一个掩模图像,并
使用它。(后边有例子)
4. histSize:BIN 的数目。也应该用中括号括起来,例如:[256]。
5. ranges: 像素值范围,通常为[0,256]

BINS:上面的直方图显示了每个灰度值对应的像素数。如果像素值为0到255,你就需要256 个数来显示上面的直方图。但是,如果你不需要知道
每一个像素值的像素点数目的,而只希望知道两个像素值之间的像素点数目怎么办呢?举例来说,我们想知道像素值在0 到15 之间的像素点的数目,接着
是16 到31,….,240 到255。我们只需要16 个值来绘制直方图。OpenCV Tutorials on histograms中例子所演示的内容。
那到底怎么做呢?你只需要把原来的256 个值等分成16 小组,取每组的总和。而这里的每一个小组就被成为BIN。第一个例子中有256 个BIN,第二个例子中有16 个BIN。在OpenCV 的文档中用histSize 表示BINS。

DIMS:表示我们收集数据的参数数目。在本例中,我们对收集到的数据只考虑一件事:灰度值。所以这里就是1。RANGE:就是要统计的灰度值范围,一般来说为[0,256],也就是说所有的灰度值

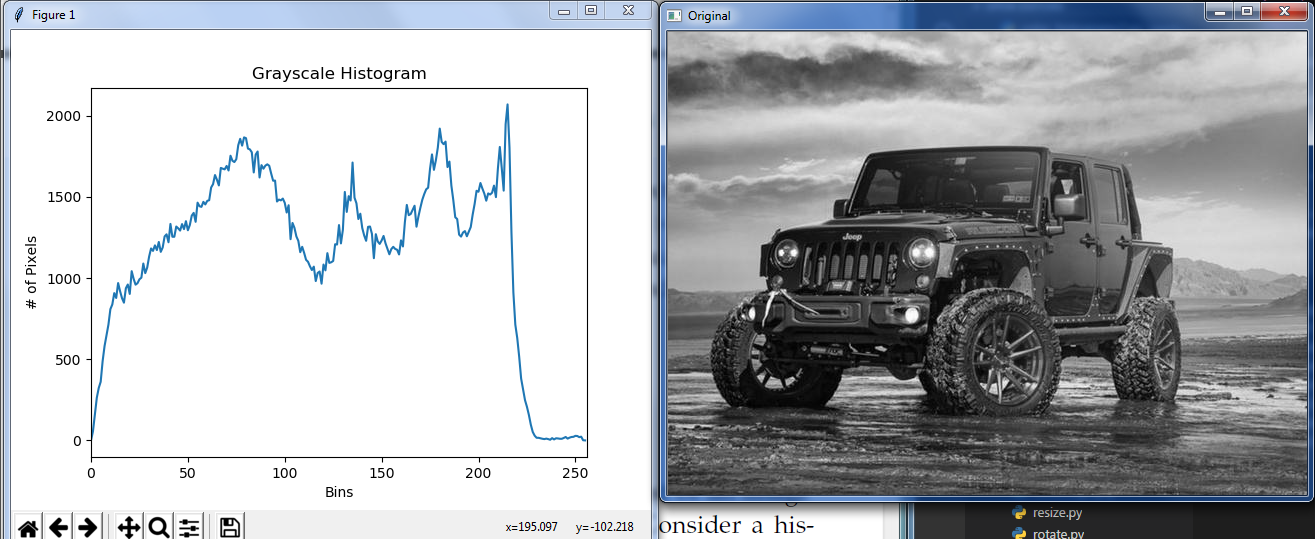
直方图grayscale_histogram.py
1
2
3
4
5
6
7
8
9
10
11
12
13
14
15
16
17
18
19
20
21
22
23
24
import numpy as np 
import argparse
import cv2
from matplotlib import pyplot as plt

ap = argparse.ArgumentParser()
ap.add_argument("-i","--image",required = True,help = "Path to the image")
args = vars(ap.parse_args())

image = cv2.imread(args["image"])

image = cv2.cvtColor(image,cv2.COLOR_BGR2GRAY)
cv2.imshow("Original",image)

hist = cv2.calcHist([image],[0],None,[256],[0,256])

plt.figure()
plt.title("Grayscale Histogram")
plt.xlabel("Bins")
plt.ylabel("# of Pixels")
plt.plot(hist)
plt.xlim([0,256])
plt.show()
cv2.waitKey(0)
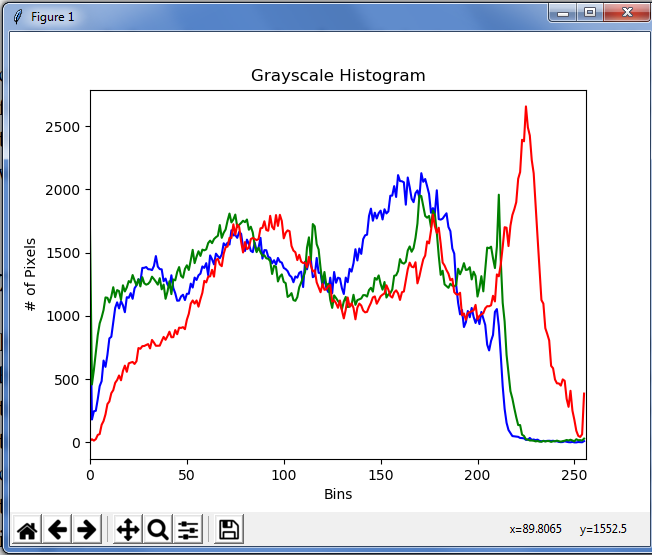
直方图color_histograms.py
1
2
3
4
5
6
7
8
9
10
11
12
13
14
15
16
17
18
19
20
21
22
23
24
25
26
from __future__ import print_function
import numpy as np
import argparse
import cv2
from matplotlib import pyplot as plt
ap = argparse.ArgumentParser()
ap.add_argument("-i","--image",required = True,help = "Path to the image")
args = vars(ap.parse_args())

image = cv2.imread(args["image"])

chans = cv2.split(image)
colors = ("b","g","r")

plt.figure()
plt.title("Grayscale Histogram")
plt.xlabel("Bins")
plt.ylabel("# of Pixels")

for (chan,color) in zip(chans,colors):
hist = cv2.calcHist([chan],[0],None,[256],[0,256])
plt.plot(hist,color = color)
plt.xlim([0,256])

plt.show()
cv2.waitKey(0)
直方图color_histograms2.py
1
2
3
4
5
6
7
8
9
10
11
12
13
14
15
16
17
18
19
20
21
22
23
24
25
26
27
28
29
30
31
32
33
34
35
36
37
from __future__ import print_function
import numpy as np
import argparse
import cv2
from matplotlib import pyplot as plt
ap = argparse.ArgumentParser()
ap.add_argument("-i","--image",required = True,help = "Path to the image")
args = vars(ap.parse_args())

image = cv2.imread(args["image"])

chans = cv2.split(image)
colors = ("b","g","r")

fig=plt.figure()

ax = fig.add_subplot(131)
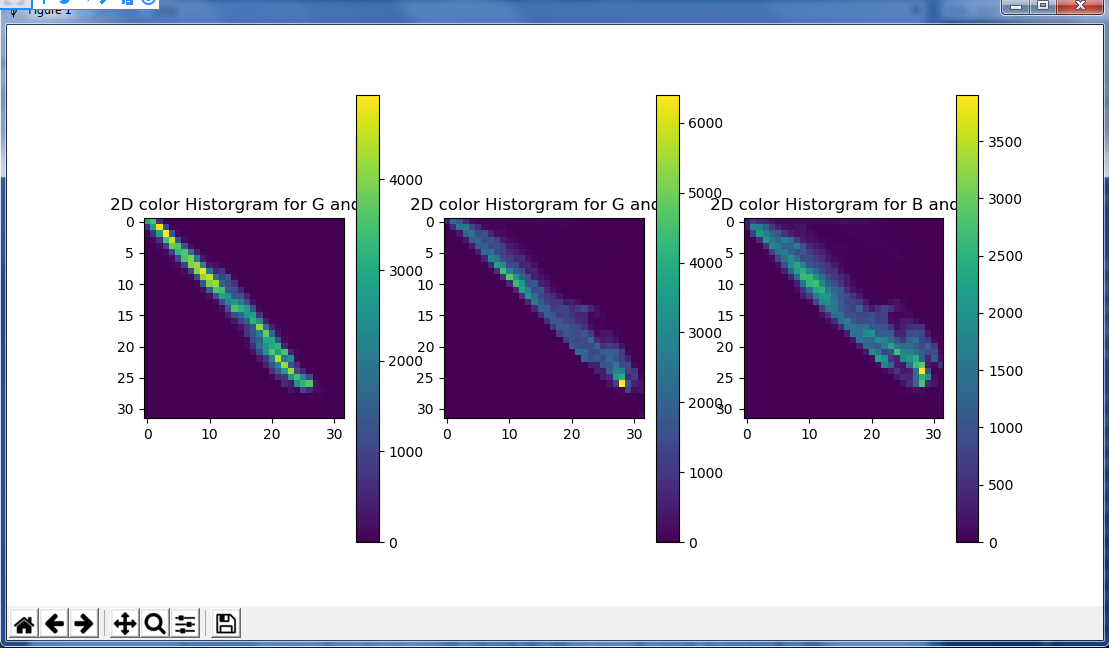
hist= cv2.calcHist([chans[1],chans[0]],[0,1],None,[32,32],[0,256,0,256])
p = ax.imshow(hist,interpolation = "nearest")
ax.set_title("2D color Historgram for G and B")
plt.colorbar(p)

ax = fig.add_subplot(132)
hist= cv2.calcHist([chans[1],chans[2]],[0,1],None,[32,32],[0,256,0,256])
p = ax.imshow(hist,interpolation = "nearest")
ax.set_title("2D color Historgram for G and R")
plt.colorbar(p)


ax = fig.add_subplot(133)
hist= cv2.calcHist([chans[0],chans[2]],[0,1],None,[32,32],[0,256,0,256])
p = ax.imshow(hist,interpolation = "nearest")
ax.set_title("2D color Historgram for B and R")
plt.colorbar(p)

plt.show()
print("2D histogram shape:{},with {} values".format(hist.shape,hist.flatten().shape[0]))

为了同时在一个窗口中显示多个图像,我们使用函数plt.subplot()。你
可以通过查看Matplotlib 的文档获得更多详细信息

蓝色阴影表示低像素计数,而红色阴影表示大像素计数(即,2D图形中的峰值)
二、直方图均衡化 -histogram equalization

直方图均衡通过“拉伸”像素的分布来改善图像的对比度。
应用直方图均衡会将峰值拉向图像的角落,从而改善图像的全局对比度。直方图均衡适用于灰度图像

执行直方图均衡仅使用单个函数完成:cv2.equalizeHist(image)它接受一个单一的参数,灰度图像,我们要执行直方图均衡。

直方图histogram_with_mask.py
1
2
3
4
5
6
7
8
9
10
11
12
13
14
15
16
import numpy as np 
import argparse
import cv2

ap = argparse.ArgumentParser()
ap.add_argument("-i","--image",required = True,help = "Path to the image")
args = vars(ap.parse_args())

image = cv2.imread(args["image"])
image = cv2.cvtColor(image,cv2.COLOR_BGR2GRAY)

eq = cv2.equalizeHist(image)

cv2.imshow("Histogram Equalization",np.vstack([image,eq]))
#hstack 横向堆叠图像 vstack纵向
cv2.waitKey(0)

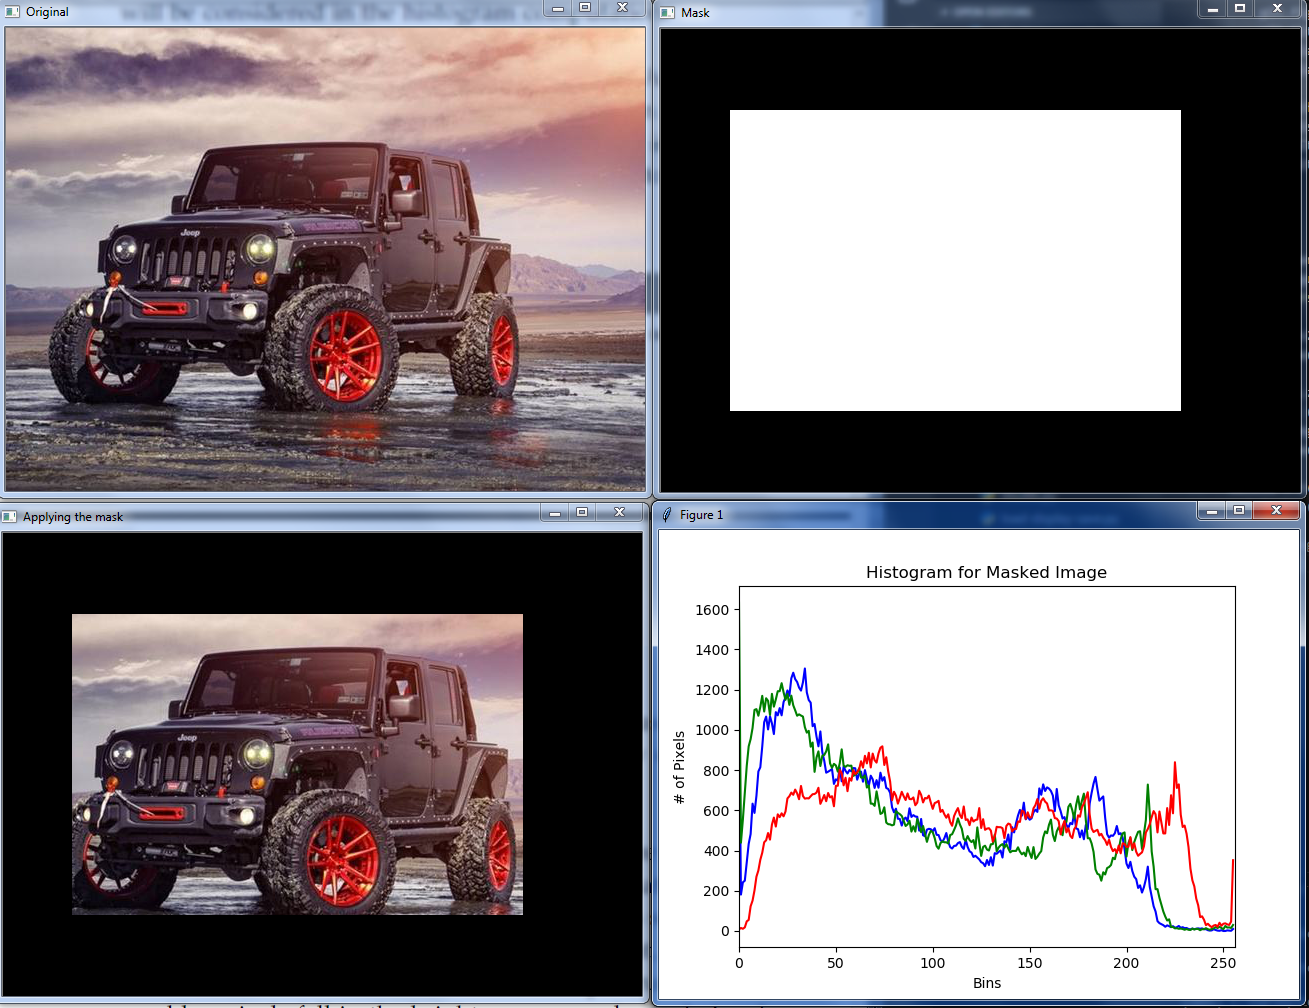
三、使用掩模

直方图histogram_with_mask.py
1
2
3
4
5
6
7
8
9
10
11
12
13
14
15
16
17
18
19
20
21
22
23
24
25
26
27
28
29
30
31
32
33
34
35
36
37
38
39
from matplotlib import pyplot as plt
import numpy as np
import argparse
import cv2

def plot_histogram(image,title,mask=None):
chans = cv2.split(image)
colors = ("b","g","r")
plt.figure()
plt.title(title)
plt.xlabel("Bins")
plt.ylabel("# of Pixels")

for (chan,color) in zip(chans,colors):
hist = cv2.calcHist([chan],[0],mask,[256],[0,256])
plt.plot(hist,color = color)
plt.xlim([0,256])


ap = argparse.ArgumentParser()
ap.add_argument("-i","--image",required =True, help="Path to the image")
args = vars(ap.parse_args())

image = cv2.imread(args["image"])
cv2.imshow("Original",image)

mask = np.zeros(image.shape[:2],dtype ="uint8")
(cx,cy) = (image.shape[1]//2,image.shape[0]//2)
cv2.rectangle(mask,(cx-250,cy-150),(cx+200 ,cy+150),255,-1)
cv2.imshow("Mask",mask)

masked = cv2.bitwise_and(image,image,mask=mask)
cv2.imshow("Applying the mask",masked)

plot_histogram(image,"Histogram for Masked Image",mask = mask)
plt.show()

人生最大的痛苦不是失败,而是没有经历自己想要经历的一切.
坚持原创技术分享,您的支持将鼓励我继续创作!