如opencv开发前的准备工作中所说,此系列文章是在学习Practical Python and OpenCV(点击下载)这本书的一些记录,发出来的文章跳过了第三章对RGB,以及numpy简单操作等介绍,请大家下载原书查看,在原书中对一下段落已进行翻译注释。文章系列完整展示代码点击下载
线和矩形
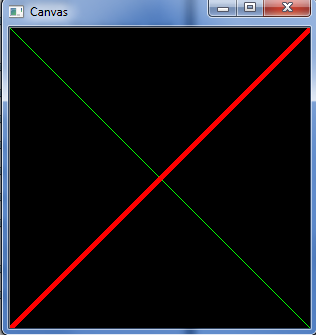
1 | import numpy as np |
运行结果如下:
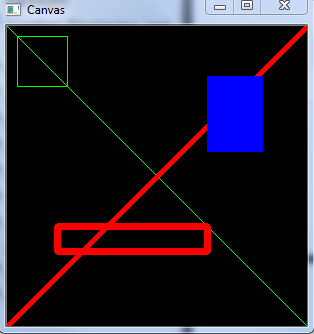
1 | cv2.rectangle(canvas,(10,10),(60,60),green) |
以上我们只绘制了一个矩形的轮廓,如何绘制一个填充满的矩形?
我们只需要通过设置厚度参数为:-1,如下1
2
3
4blue = (255, 0 , 0)
cv2.rectangle(canvas,(200,50),(255,125),blue,-1)
cv2.imshow("Canvas",canvas)
cv2.waitKey(0)
运行结果如下:
圆
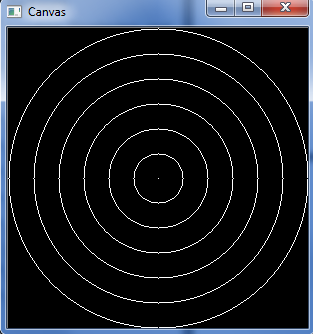
1 | canvas = np.zeros((300,300,3),dtype = "uint8") |
运行结果如下:
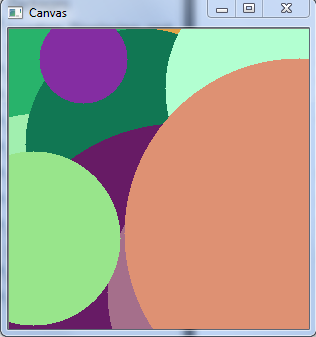
画一个半径,中心点随机的填充多圆图1
2
3
4
5
6
7
8for i in range(0, 25):
radius = np.random.randint(5, high =200)
使用np.random.randint 生成一个5到200之间的随机数
color = np.random.randint(0, high =256,size=(3,)).tolist()
pt = np.random.randint(0, high=300, size = (2,))
cv2.circle(canvas,tuple(pt),radius,color,-1)
cv2.imshow("Canvas",canvas)
cv2.waitKey(0)
运行结果如下:
扩展
1 | numpy.random.randint(low, high=None, size=None, dtype='l') |
Return random integers from low (inclusive) to high (exclusive).
Return random integers from the “discrete uniform” distribution of the specified dtype in the “half-open” interval [low, high). If high is None (the default), then results are from [0, low).
Parameters:
- low : intLowest (signed) integer to be drawn from the distribution (unless high=None, in which case this parameter is one above the highest such integer).
- high : int, optionalIf provided, one above the largest (signed) integer to be drawn from the distribution (see above for behavior if high=None).
- size : int or tuple of ints, optionalOutput shape. If the given shape is, e.g., (m, n, k), then m n k samples are drawn. Default is None, in which case a single value is returned.
- dtype : dtype, optionalDesired dtype of the result. All dtypes are determined by their name, i.e., ‘int64’, ‘int’, etc, so byteorder is not available and a specific precision may have different C types depending on the platform. The default value is ‘np.int’.New in version 1.11.0.
Returns:
- out : int or ndarray of intssize-shaped array of random integers from the appropriate distribution, or a single such random int if size not provided.
道虽迩,不行不至;事虽小,不为不成

